A Guide to Your Location History Visualizer

Ever wonder where all that location data your phone collects actually goes? A location history visualizer takes that raw, boring stream of GPS coordinates and turns it into a vivid, interactive story of your life's travels.
Instead of a spreadsheet of numbers, you get a personal map showing every path you’ve taken and every place you’ve spent your time. I've found it's a fascinating way to truly see your journeys, from the daily grind to that unforgettable road trip.
What Exactly Is a Location History Visualizer?
Have you ever tried to retrace the exact route of a past vacation or wondered which parts of your city you really hang out in the most? A location history visualizer is the tool that brings those answers to life. Think of it as a personal time machine for your movements, transforming abstract data points from your phone into something you can actually see and interact with.
A good visualizer doesn't just drop pins on a map; it connects the dots. It can draw the precise lines of a cross-country drive or build a colorful heatmap that instantly reveals your favorite neighborhoods, coffee shops, and parks. It’s all about making your own data understandable and, frankly, pretty cool to explore.
It's More Than Just a Fun Distraction
Seeing your past travels mapped out is one thing, but the practical uses go way deeper. People are using these tools to turn their digital footprints into some genuinely useful insights.
Here’s why you might want to do this:
- Build a Digital Travel Journal: Automatically log every step of a trip, creating an interactive scrapbook of your adventures you can look back on for years.
- See Your Own Habits: Get a clear picture of your daily and weekly routines. Are you hitting the gym as much as you think? How has your commute changed over time?
- Rediscover Forgotten Moments: The best discoveries are often the small detours and forgotten stops—the kind of thing a simple list of addresses would never capture.
A location history visualizer turns a dry list of coordinates into a living document of your experiences. It provides context, reveals patterns, and helps you tell the story of where you've been in a way that data alone never could.
Turning Raw Data Into a Story
At its core, the real magic of a location history visualizer is its ability to create a narrative. It doesn't just show you where you went; it shows you how you got there. That jump from static points to dynamic paths is what makes the whole thing so compelling.
You can see the winding mountain roads from that summer road trip, the overlapping routes of your daily life, or the concentrated glow of a city you explored entirely on foot. Each visualization is a unique map of your personal history, built from the digital breadcrumbs you leave behind every day. It's your story, told through geography.
How Your Digital Footprints Become a Map
So how does a bunch of abstract data from your phone magically become a detailed map of your life? It’s a lot like connecting the dots in a massive, invisible drawing that follows you everywhere you go. Once you peek behind the curtain, the process is surprisingly straightforward.
It all starts with data collection. Every time your phone pings a cell tower, hops on a Wi-Fi network, or uses its GPS, it can log your coordinates. Services like Google Maps quietly gather these digital breadcrumbs, building a massive, continuous log of your movements, complete with timestamps.
This raw data is the absolute lifeblood of any location history visualizer. Without it, there’s nothing to map.
Decoding Your Digital Diary
Your location history is usually packed into specific file formats that are designed to be read by computers. Think of these as the raw ingredients for our visual recipe. To us, they might look like a jumble of code, but they contain a perfectly organized record of your journeys.
The most common formats you’ll bump into are:
- Google's JSON files: When you download your history from Google Takeout, you get a file in JSON (JavaScript Object Notation) format. It’s a text-based format that lays out your data in a clean, hierarchical structure, showing you the places you’ve been and the paths you took to get there.
- GPX (GPS Exchange Format): This is the universal standard loved by fitness apps and hiking gadgets. It's an XML-based file that logs waypoints, routes, and tracks, making it perfect for recreating a specific trip from start to finish.
- KML (Keyhole Markup Language): Originally created for Google Earth, KML files are fantastic for displaying geographic data in an Earth browser. They can hold anything from points and lines to even 3D models.
From Raw Data to a Visual Story
Once you've got your data file, the visualizer tool steps in to act as the translator. It combs through thousands of data points—each one a specific latitude, longitude, and time—and starts plotting them on a digital map. It's essentially an automated game of "you were here... then here... then here."
The tool then connects these dots chronologically, drawing lines that trace the exact routes you traveled. If the data shows you hung out in one spot for a while, the visualizer can interpret that as a significant stop or a place you visited.
This is where the real magic happens. A good visualizer doesn't just plot dots; it interprets the data to create meaningful pictures like routes, timelines, or heatmaps. It turns a sterile log file into a personal story.
The value here goes way beyond just satisfying your own curiosity. Businesses are catching on to the power of mapping in a big way. A Boston Consulting Group survey found that 95% of executives see geospatial analytics as critical for getting results, and this reliance is only growing. This trend is fueling the global location intelligence market, which is expected to hit nearly USD 35 billion by 2029, as companies use these tools for everything from picking store locations to optimizing delivery routes.
For you, this powerful technology can reveal patterns you’d otherwise miss completely. You might realize your commute has slowly gotten longer over the years or rediscover a hidden gem from a vacation you took long ago — all because a tool was able to connect the dots.
Choosing the Right Visualizer Tool for You
Not all visualizer tools are built the same, and picking the right one really boils down to what you’re trying to do. Think of it like choosing a camera: sometimes your phone is all you need for a quick snapshot, but other times, you want a professional DSLR with a bag full of lenses. Location history visualizers are a lot like that.
It all starts with figuring out what you actually want. Are you just curious and looking for a simple, automated summary of your year? Or are you a data geek who wants to dig deep, applying custom filters and running your own analysis?
Let's walk through the main options out there.
Built-in Services: The "Set It and Forget It" Option
For most people, the simplest starting point is a built-in service like Google Timeline. If you have location history turned on for your Google account, it’s already been quietly logging your movements in the background. It automatically pieces together your travels, figures out the places you’ve visited, and gives you a clean, straightforward look at your life on the map.
The biggest draws here are convenience and automation. You don't have to set anything up, download any files, or install a single piece of software. It just works.
- Pros: Completely hands-off, easy to check anytime, and great for a simple day-to-day recap.
- Cons: Very limited customization, you have less control over your own data, and you're locked into the Google ecosystem.
This is the perfect choice if you just want a casual look back at your travels without getting technical. It's the point-and-shoot camera of the visualizer world.
Dedicated Web and Desktop Apps
If you're ready for a bit more control, dedicated web and desktop applications are the next step up. These tools are specifically built to import your location data—usually from a Google Takeout file—and give you more powerful ways to explore it. You can start filtering by date, switching between different views like heatmaps and routes, and really analyzing your patterns.
These apps hit a sweet spot. They offer far more features than the built-in services but are still pretty easy to get the hang of. You can finally interact with your data in more meaningful ways, like isolating a specific road trip or seeing a density map of your most frequented spots in the city.
A dedicated app unlocks what’s really hiding in your location data. Instead of just seeing where you've been, you can start asking why and how, turning a simple log into a powerful tool for self-reflection.
Self-Hosted Solutions: For Ultimate Privacy and Control
For anyone who puts data ownership and privacy first, self-hosted solutions are the only way to go. A self-hosted location history visualizer means you run the software on your own server—this could be a spare computer at home or a private cloud server you rent. The bottom line is, you have complete and total control over your personal information.
Tools like Dawarich are designed around this privacy-first idea. You import your data, and it stays entirely within your environment, never uploaded to a third-party service you don't manage. This completely sidesteps the privacy trade-offs you make with other platforms. To see what this feels like, you can check out a timeline visualizer that puts you in the driver's seat.
This path does take a bit more technical know-how to set up (you'll likely run into tools like Docker), but for privacy-minded folks, the payoff is huge. You get powerful features, true ownership of your data, and the peace of mind that comes from knowing your digital footprints are truly your own.
Comparing Location History Visualizer Options
To help you decide, here’s a breakdown of the common visualizer types. Think about what matters most to you—simplicity, features, or privacy—to find the best fit.
| Feature | Built-in Services (e.g., Google Timeline) | Dedicated Apps (Web/Desktop) | Self-Hosted Solutions (e.g., Dawarich) |
|---|---|---|---|
| Privacy | Low (Data held by a third-party) | Medium (Data processed locally, but app is third-party) | High (You own and control everything) |
| Ease of Use | Very High (Fully automated) | High (Simple import process) | Low (Requires technical setup) |
| Customization | Very Low (Basic views only) | Medium (Filtering, some map options) | Very High (Full control over data and display) |
| Data Control | None (Data is on their servers) | Limited (You provide the file) | Complete (You host the data and software) |
| Cost | Free | Free to Paid | Free software, but potential server costs |
| Best For | Casual users wanting a simple summary. | Data enthusiasts who want deeper insights without technical overhead. | Privacy-conscious individuals and tech-savvy users. |
Ultimately, there’s no single "best" tool—it's all about what works for you. Whether you want a quick glance or a deep dive, there’s an option out there that will bring your personal map to life.
How to Visualize Your Own Location History
Alright, let's get our hands dirty and turn that mountain of raw data into something you can actually see and explore. This is where we move from theory to practice and build your own interactive map. Don't worry, the journey from a data file to a full-blown visualization is much easier than it sounds.
We'll start with the most common first step for most people: getting your data out of Google's hands. After that, we'll walk through setting up a self-hosted location history visualizer called Dawarich. It’s an awesome tool that gives you total control over your private information.
Step 1: Exporting Your Data from Google Takeout
Before you can map out anything, you need the raw ingredients. If you’re an Android user (or even an iPhone user with Google Maps installed), Google has been logging your every move. Thankfully, they offer a tool called Google Takeout that lets you download a copy of it.
Getting the right file is the key here. It’s pretty straightforward.
- Head over to Google Takeout: Open up the official Google Takeout site. You’ll see a massive list of every Google service that has a piece of your data.
- Deselect Everything: By default, it wants to give you everything. Immediately click "Deselect all" at the top. Trust me, you don't need your old YouTube comments for this project.
- Find and Select Location History: Now, scroll down until you spot "Location History" and just check that one box. This tells Takeout you only want that specific dataset. The format will be JSON, which is exactly what we need.
- Create the Export: Scroll to the bottom and hit "Next step." On the next screen, you can just stick with the defaults (export once, .zip file) and click "Create export."
Google will start packaging up your history. This might take a few minutes or a bit longer, depending on how much data you have. You’ll get an email with a download link when it's all ready.
Step 2: Setting Up a Self-Hosted Visualizer with Dawarich
Once that .zip file is on your computer, it's time to bring it to life. For this guide, we're using Dawarich because it’s a powerful, privacy-first option you can run on your own machine. That means your sensitive location data never leaves your computer or gets uploaded to some random third-party service.
The magic of self-hosting is data ownership. When you run the software yourself, you're not just a user—you're the administrator. Your personal history stays completely under your control, from start to finish.
The idea of "self-hosting" might sound a little techy, but tools like Docker make it surprisingly simple. Think of Docker as a way to run applications in their own neat little boxes, so you don't have to fuss with complicated setup and configuration.
This infographic breaks down the choice you have, from easy-but-less-private cloud services to the more controlled, self-hosted route we're taking.
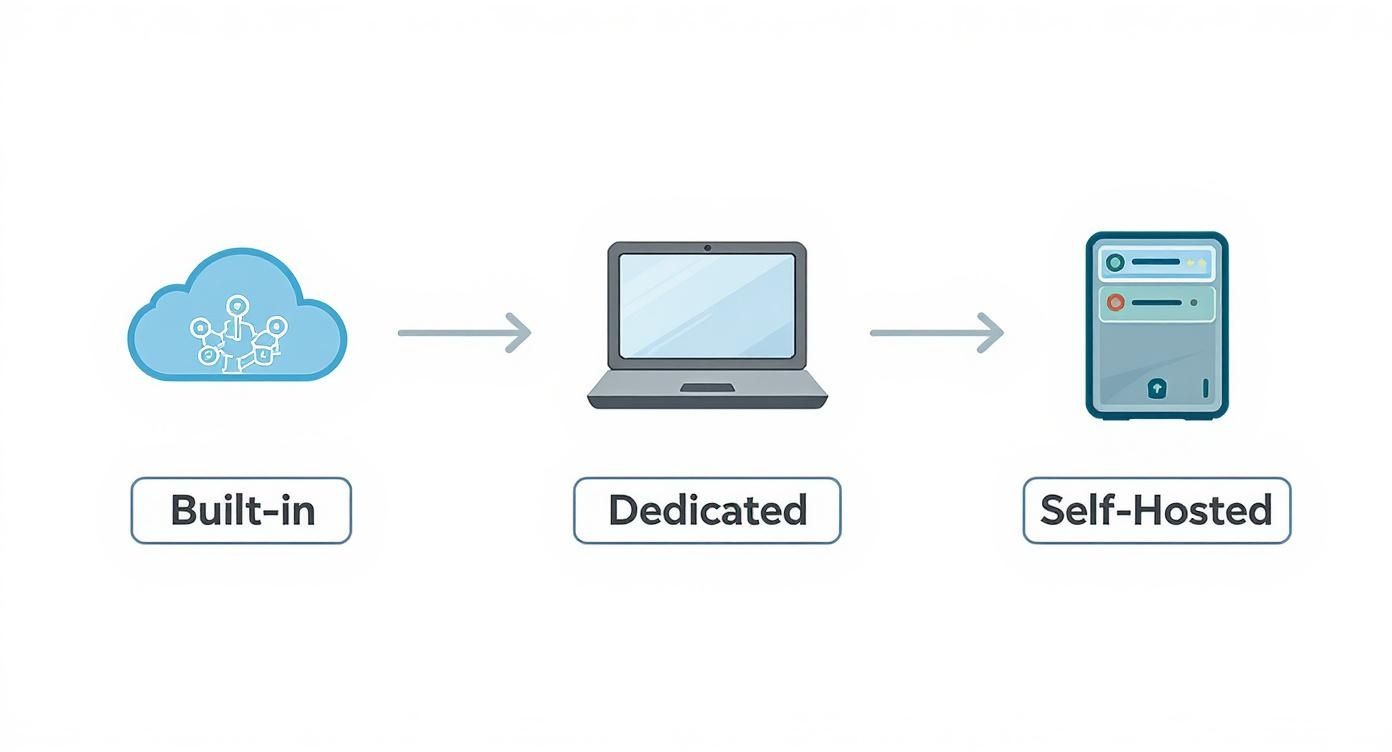
As you can see, you trade a little bit of initial convenience for a massive gain in privacy and control by going the self-hosted route. It's a worthy trade-off.
Step 3: Installation and Data Import
The Dawarich project keeps everything you need—code, documentation, and instructions—on its GitHub page.
While the exact commands might differ slightly based on your computer, the general process with Docker is a breeze:
- Install Docker: If you don't have it, you'll need to install Docker first. It's a one-time setup.
- Run the Dawarich Container: You'll run a single command from the Dawarich documentation. This will automatically download and start the application.
- Import Your Data: With Dawarich running, open it in your web browser. You’ll see an option to import your Google Takeout file. Just unzip the file you downloaded, find the
Location History.jsonfile inside, and upload it.
The platform will chew on the data for a bit and then, like magic, your personal map will start to fill in. For a more detailed walkthrough, you can follow this excellent guide on migrating from Google Location History to Dawarich.
This whole field of location analytics is absolutely exploding. We're talking about a market that was valued at around USD 31.3 billion in 2025 and is expected to rocket to USD 124.3 billion by 2035. This boom is fueled by all the smart devices and IoT tech that generate a constant stream of location data. This data is used for everything from city planning to, well, personal journaling.
By setting up your own visualizer, you’re basically tapping into this powerful technology for your own benefit. You can find more details on the growth of the location analytics market on futuremarketinsights.com.
Practical Ways to Use Your Visualized Data
https://www.youtube.com/embed/SXAShotdFZo
So, you’ve wrestled with Google Takeout, set up your own visualizer, and now you’re staring at this incredible, intricate map of your life. The big question is: now what? This is more than just a cool digital art project. This is where your data stops being a passive log and starts becoming a tool for reflection, planning, and even storytelling.
Turning those colorful lines and heatmaps into something genuinely useful is the most rewarding part of the whole process. Whether you're a travel junkie, a creature of habit, or just someone curious about your own patterns, there are tons of practical applications waiting to be discovered. It's a chance to see your life from a completely new angle.
For Personal Reflection and Habit Analysis
One of the most powerful uses for your visualized data is simply getting to know yourself better. A location history visualizer acts like a mirror, reflecting your habits and routines back at you in a way you've never seen before. You might think you have a good handle on your weekly schedule, but the map doesn't lie.
This kind of visual feedback can be incredibly eye-opening if you're looking to make some intentional changes.
- Analyze Your Routines: See exactly how your commute has shifted over the years. Is that new shortcut actually saving you time, or just adding stress? The data will tell you.
- Track Your Goals: Wondering if you're hitting the gym as often as you promised yourself? A heatmap will quickly show you which locations dominate your time—the fitness center or the coffee shop down the street.
- Rediscover Your City: You can easily spot the neighborhoods you gravitate towards and the ones you’ve completely neglected. It’s a great way to inspire yourself to break out of your bubble and explore new places right in your own backyard.
Your location data tells a story about your priorities, whether you realize it or not. Visualizing it lets you read that story and decide if you want to write a different one.
For Travel Journaling and Future Planning
For anyone who loves to travel, a location history visualizer is the ultimate digital scrapbook. Forget trying to remember the name of that amazing little restaurant you stumbled upon in a new city—your map already has it logged. It creates a definitive, interactive record of your adventures.
You can relive a trip by tracing the exact path you took, seeing every detour and spontaneous stop along the way. But it’s not just about looking back; it’s also an incredible tool for planning what's next. By analyzing your past trips, you can see what kinds of places you're naturally drawn to and plan future adventures that build on old favorites.
For Professional and Creative Projects
Beyond personal use, visualizing location data has some surprisingly practical professional applications. For people in certain fields, this kind of log is more than just a novelty; it’s a functional dataset that can inform their work and creative projects.
Just think about these examples:
- Photographers: Can automatically log every shoot location, making it a breeze to return to a great spot or find new angles in a familiar area.
- Urban Cyclists: Can analyze their most frequent routes to identify safer or more efficient paths, contributing to a better understanding of city infrastructure.
- Field Researchers: Can document their movements through a study area, providing a verifiable record of where and when data was collected.
Managing Your Location Data with Privacy in Mind
Let's be real for a second. Diving into your location history is a blast—it’s like re-reading your own personal travel diary. But this data is about as personal as it gets. Handling it with care isn't just a suggestion; it's a must.
This leads you to a crossroads: do you go for convenience or for control? Using a service like Google Timeline is super easy, but it means handing over the keys to your entire movement history to a massive company. On the other hand, a personal location history visualizer puts you in the driver's seat, ensuring your data never leaves your sight.
Taking Control of Your Digital Footprint
Managing your privacy doesn’t mean you have to go live in a cave. It’s mostly about being mindful and making a few smart tweaks to how you share your info. Good digital habits are your best defense.
Here are a few practical things you can do right now:
- Review App Permissions Regularly: Go through your phone and see which apps are tracking your location. Does that puzzle game really need to know where you are 24/7? Probably not. Shut it down.
- Be Selective with Tracking: You don't need location services running all the time. Try turning it off when you're not actively using it for maps or directions.
- Understand the Trade-Off: For any service that wants your location, ask a simple question: "What am I getting out of this?" Is the convenience truly worth what you're giving away?
The goal isn't to go completely off the grid. It's about making conscious decisions, understanding what you're sharing, and choosing tools that match your personal comfort level for privacy.
For anyone who really wants to take ownership of their data, setting up a privacy-focused visualizer is a fantastic project. If you're curious to learn more, there's a great guide on building a privacy-first Google Timeline visualizer that covers the thinking and the step-by-step process.
Anonymizing Data Before You Share
So, you’ve made an awesome visualization—maybe a heatmap of your favorite running trails—and you want to show it off. That's great! But before you hit "post," you need to scrub it of anything that points back to you. Raw location data can easily give away your home, your workplace, and other sensitive spots.
Before you share anything publicly, take a few minutes to anonymize your map. This could mean:
- Generalizing Start and End Points: Don't show the exact dot where your house or office is.
- Removing Timestamps: Timestamps can reveal your daily routine, like when you leave for work or when your house is empty.
- Fuzzing the Data: You can slightly reduce the precision of the GPS coordinates, making it impossible to pinpoint an exact address.
Taking these simple steps lets you share your cool data stories with the world without putting your privacy on the line. It's all about finding that sweet spot between enjoying your data and keeping yourself safe.
Got Questions? We've Got Answers
Diving into location history visualizers for the first time usually sparks a few questions. It's a pretty personal and fascinating topic, so it's totally normal to be curious about how it all works. Here are some quick answers to the things people ask most often.
Is It Safe to Use an Online Visualizer?
That’s the million-dollar question, isn't it? The honest answer is: it really depends. When you upload your location data to some random website, you're placing a lot of trust in them to keep it safe. Many services are legitimate and secure, but you're still handing over incredibly sensitive information.
The only way to have 100% peace of mind is to use a self-hosted location history visualizer. When the software and your data live on your own computer or server, you slam the door on third-party risks like data breaches or sketchy privacy policies. You're the only one in control.
Can I See My iPhone's Location History?
Absolutely, though it's not as straightforward as it is with Google. Apple doesn't have a simple, one-click "Takeout" button for your location history. The most reliable way to do it is to use a third-party app that tracks your location and lets you export the data as a GPX file.
Once you have that GPX file, you can pop it into any visualizer that supports the format. While your iPhone does keep track of "Significant Locations," Apple keeps that data pretty locked down and it isn't designed for easy exporting.
What's the Difference Between a Heatmap and a Path Map?
It really boils down to seeing where you spend your time versus how you got there.
A path map is literal. It connects the dots and draws the exact lines of your travels, showing your journey in chronological order. It's fantastic for reliving a road trip or analyzing your daily commute.
A heatmap, on the other hand, is all about density. It uses colors—usually getting hotter, like red, for more activity—to show the places you frequent most. It gives you a quick, powerful snapshot of the central hubs of your life.
Ready to take back your story and build a map that's truly yours? Dawarich is a privacy-first platform built for just that. Import your history, create stunning visualizations, and own your data from the get-go. Start your free 7-day trial today.